
The historical background
UPDATE! The project has progressed thanks to funding and it has now a dedicated website showcasing two more maps: York and Oxford. London, York and Oxford maps have been created with new information and there are podcasts to dramatise interesting cases.
Visit https://medievalmurdermap.co.uk/ and enjoy more interactive maps, background information and podcasts. The original London map won't be updated. You can also follow the dedicated Twitter/X account of the new website at @MediMurderMaps.
- How violent was medieval London?
- When did murders happen?
- Where did murders happen?
- Modus Operandi: how were murders committed?
- Who were the perpetrators?
How violent was medieval London?
The surviving Coroners' Rolls comprise 142 cases of homicides committed within the boundaries of the City of London. The number fluctuated between 13 and 22 cases per year, with an annual average of 16 cases. Does this mean that Medieval London was a violent place? Any answer to this question first requires an estimate of how many people lived in the City of London (excluding Southwark and suburbs outside its walls) during the first half of the 14th century.
Such estimates vary widely between 40,000 and 100,000. If we accept a population of around 80,000, the homicide rate in London turns out to be about 20 per 100,000 inhabitants per year. This is about 15-20 times more than what we would expect in a UK city of equal size in our times, but a lot lower than the rates that are currently found in some of the most violent cities in the world.
However, comparisons with modern society are fraught with problems; for example, in our days firearms make it much easier to kill than in the Middle Ages. On the other hand, penicillin and emergency services keep injured people alive in greater numbers if they survive the first hour after the attack. Yet we don’t know how to factor in the arms' race between technologies of killing and technologies of healing over the past 700 years.
At any rate, readers of the events described in the Coroners Rolls may notice that life in medieval London was rough. Weapons were readily available; male honour had to be protected and conflicts could easily escalate. However, it was by no means a lawless place; there is little sign, for example, of the kinds of instrumental violence like robberies, kidnappings, protection rackets or organised gang warfare that plight the violent cities and neighbourhoods of the 21st century.
When did murders happen?
Most Coroners’ Rolls have information about the date, weekday and time of the day when the crime occurred. Historians can use it to build a detailed picture on how homicide was embedded in life's rhythms in a medieval city.
Seasons
In the countryside homicide was linked to the rhythm of agricultural life and was most frequent in the summer months. However, in London no clear concentration of homicides over the course of the year can be found, possibly a sign that urban life followed similar rhythms throughout the seasons of the year. The lowest observed frequencies were in April (5 cases), January (8 cases) and December (9 cases), while the highest frequencies were in November (22 cases), May (15 cases) and June (15 cases).
Weekdays
Like in modern societies, homicide was most likely at weekends. Almost a third of all cases (44) occurred on Sundays. Sunday was the day when people had the time to engage in social activities - drinking and playing games that would occasionally trigger frictions leading to assault. Mondays had the second highest frequency of homicides with 30 cases. It is unclear why, but one possible explanation might be that weekend's conflicts spilled over into the first day of the week.
TABLE 1: Distribution of homicides over the weekdays (N = 142)
WEEKDAY | CASES | % |
Monday | 30 | 21.1% |
Tuesday | 10 | 7.0% |
Wednesday | 14 | 9.9% |
Thursday | 14 | 9.9% |
Friday | 15 | 10.6% |
Saturday | 15 | 10.6% |
Sunday | 44 | 31.0% |
Time of the day
In the absence of clocks, the medieval records used the course of daylight, the liturgy of the hours and the curfew to note when a crime had occurred. They would say 'at day break', 'at the hour of vespers' (early evening prayer, around 6pm), 'after sunset', 'after curfew' (around 8pm in winter and 9pm in summer) or at the hour of compline (night prayer before retiring, around 9pm).
The vast majority of cases, namely around 77% of all murders, occurred between the early evening and the first hours after curfew, when a bell signalled that city's inhabitants were expected to extinguish their fires and go to bed.
TABLE 2: Distribution of homicides over the time of the day (N = 142)
TIME OF THE DAY | CASES | % |
Day break (5-8am) | 3 | 2.1% |
Morning (8-11am) | 2 | 1.4% |
Lunchtime and afternoon (11am-5pm) | 2 | 1.4% |
Early Evening (5-8pm) | 44 | 31.0% |
Late Evening (8-10pm) | 65 | 45.8% |
Night (10pm-2am) | 14 | 9.9% |
Unknown | 12 | 8.5% |
Total | 142 | 100.0 |
Where did murders happen?
The busy streets, squares, markets and wharfs of medieval London were the most likely places where homicides occurred, accounting for a total of 68% of all cases. A look at the murder map reveals that while murders could happen anywhere in the city, two main areas emerge as hotspots of homicide. The first is the stretch of Cheapside from St Paul's to the East to St Mary's le Bow church to the West, one of the commercial hubs of the city, crowded by stalls and shops where merchants of different trades had their designated areas. A second major area with a high density of homicides was further West and included the streets around the triangle of Gracechurch Street, Lombard Street (called Langbourn Street at the time) and Cornhill Street, again an important centre of commerce radiating out from Leadenhall Market and comprising the main junctions between the North-South and East-West traffic arteries through London.
About 21% of all homicides occurred in private space; their geographic location is much more evenly scattered across the entire built-up area of London.
TABLE 3: Distribution of homicides by social space
SPACE TYPE | LOCATION | CASES | % |
Public Space | Street, square | 75 | 52.8% |
Public space, unspecified | 14 | 9.9% | |
Stall, business place | 3 | 2.1% | |
Wharf, riverside | 4 | 2.8% | |
In buildings | Tavern | 6 | 4.2% |
Brothel | 2 | 1.4% | |
Religious Building | 6 | 4.2% | |
Prison | 1 | 0.7% | |
Private space | Perpetrator's residence | 12 | 8.5% |
Victim's residence | 10 | 7.0% | |
Third party residence | 8 | 5.6% | |
Unknown | 1 | 0.7% |
Modus Operandi: How were murders committed?
In fulfilment of his office, the Coroner generally took careful notes of the circumstances of the violent death as established by the investigative jury. This generally comprised an accurate description of the murder instrument, the body part against which the assault had been directed, the nature of the wounds, including length and depth and the time that had passed between the initial assault and the death of the individual.
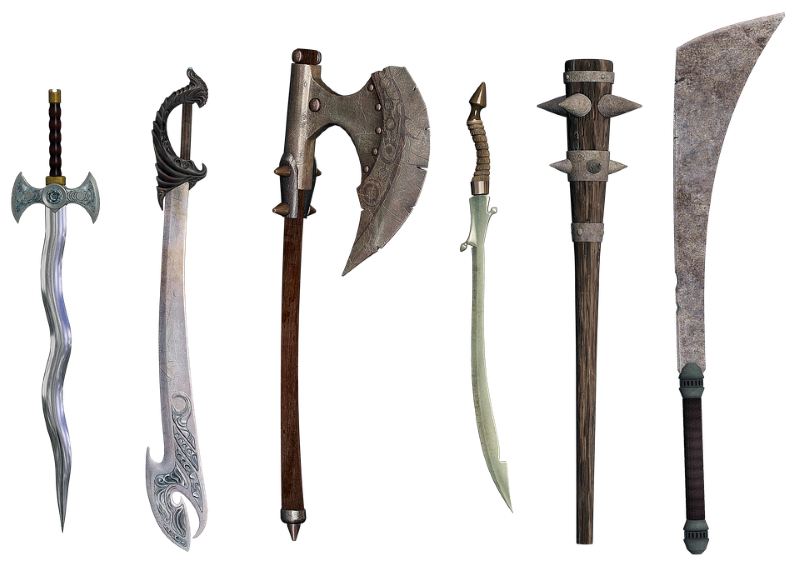
Weapons
Men in late medieval London were armed. Most perpetrators and many victims had weapons at their disposal when a conflict arose. Knives and swords of different lengths and types dominated in 68% of all cases. Similar to modern distinctions of firearms by calibre and brand name, the Coroner often recorded the exact name of the knife, including 'Twytel', 'Trenchour', 'Irish Knife', 'Anelace', 'Baselard', 'Misericorde' or 'Fauchon'; 19% of all homicides were committed with quarter staffs, long thick poles designed for close combat and made out of hardwood. These were sometimes reinforced with iron tips.
TABLE 4: Weapons used in homicide cases
WEAPON | CASES | % |
Axe | 2 | 1.4% |
Long Knife | 51 | 35.9% |
Short Knife | 29 | 20.4% |
Sword | 17 | 12.0% |
Staff | 27 | 19.0% |
Bow | 1 | .7% |
Hands | 11 | 7.7% |
Stone | 1 | .7% |
Drowning | 2 | 1.4% |
Unknown | 1 | .7% |
Total | 142 | 100.0 |
Direction of the attacks
In 94% of the cases, the records provide specific information on the body part that had been targeted in the assault. The upper body was the most likely target; 42% of all wounds were inflicted primarily on the head, neck and throat. Another 30% of all attacks were directed against the chest, arms and shoulders.
TABLE 5: Body parts targeted in the attacks
Head | 50 | 35.2% |
Neck | 3 | 2.1% |
Throat | 7 | 4.9% |
Hands, arms, shoulders | 9 | 6.3% |
Chest, heart | 34 | 23.9% |
Back | 4 | 2.8% |
Lower trunk | 14 | 9.9% |
Legs | 2 | 1.4% |
Multiple wounds on different body parts | 11 | 7.7% |
Other and unknown | 9 | 6.3% |
Total | 142 | 100.0 |
Time of death
In our contemporary society, most victims that survive the first hour of a violent attack are taken to an emergency ward where specialist treatment massively increases their chances of survival. In the Middle Ages, death often came only after hours, days or weeks of agonising suffering. In the present sample, about a third of the victims died immediately; another 15% died within the first six hours or so. On the other hand, over 18% of the victims survived for a week or longer. They eventually died from infections, inner injuries or blood loss resulting from the initial trauma.
TABLE 6: Death timeline
TIME FROM ASSAULT TO DEATH | CASES | % |
Immediate | 46 | 32.4% |
Less than 2 hours | 9 | 6.3% |
2-6 hours | 13 | 9.2% |
6-12 hours | 6 | 4.2% |
12-24 hours | 11 | 7.7% |
2 days | 9 | 6.3% |
3-4 days | 10 | 7.0% |
5-6 days | 9 | 6.3% |
One week | 6 | 4.2% |
2-4 weeks | 15 | 10.6% |
More than 1 month | 5 | 3.5% |
Unknown | 3 | 2.1% |
Who were the perpetrators?
Gender of perpetrators
Like in our contemporary society, murders were predominantly committed by men. The Coroners' Rolls refer to a total of 238 main suspects and accomplices; 92% of the perpetrators were male and 8% female. In four cases a woman was the only suspect. One case related to a woman who beat a boy to death after he had stolen a small amount of wool (C.15). In another case, Agnes, a prostitute, had a quarrel with Lucy, a pregnant woman, punching her in the stomach. A third case describes a female beggar named as Nicola from Cardiff drowning her three-month old child in a ditch close to the Tower of London. In the final case, Isabella Heron had a quarrel with her lover William Mysone, a fishmonger, whom she stabbed to death with a knife.
Groups of perpetrators
About a third of all cases involved two or more suspects; in seven cases five or more perpetrators were involved. Co-offenders were typically brothers (5 cases) or other family members, other men working in the same business (4 cases), servants helping their master or more broadly members of a group of men who belonged together. Both cases with over 10 suspects occurred in 1325/26 and show the strong sense of group allegiance in medieval London.
On a Sunday night in November 1325, 12 men of the Goldsmiths Guild walked down Cheapside waiting to beat up members of the Saddlers Guild on account of a quarrel that had arisen between the two Guilds. In an outburst of violence, several men attacked a John of Vyse, member of the Saddlers Guild, one striking him with a sword, one almost cutting off his leg with an axe, and the third beating him with a staff as he lay on the pavement.
A similar case of group violence occurred on a Sunday of June in the following year. Two large groups of law students from Yorkshire and Norfolk had assembled outside Aldersgate at sunset. They had their swords drawn to fight over a dispute between the students of the two counties and a large crowd of bystanders quickly assembled. At that moment the servants of Sir Nicolas de Hougate, whose house was next to the riotous gathering, decided to try and disperse the crowd. One of them shot an arrow into the crowd killing Simon de la Fermorie, a skinner.
Age of perpetrators and their victims
The Coroners' Rolls never specify the age of perpetrators or victims in years. However, individuals are sometimes referred to as a 'child' or the 'son of'. Alternatively, their occupational role is given as 'apprentice' or 'squire' - both indicating that they had not yet acquired full adult status.
Using this information, we find that 12 main suspects (i.e. 8.4% of the total) and 11 victims (7.7%) were adolescents or children. These rates are similar to the proportion of homicide victims and perpetrators typically found in modern western societies.
Occupation of perpetrators
Lethal violence was perpetrated by all social classes in medieval London. In 88 cases the clerk who wrote up the findings of the jury noted the occupation or social background of the principal suspects.
Five principal suspects are identified as belonging to the higher echelons of society: a knight, a chamberlain, two esquires and a wealthy merchant. The events suggest that their violence mirrors their status. In October 1321, for example, Thomas Attchurch, esquire of the Earl of Arundel, rode through Thames Street on his horse. He almost threw a woman who carried a child to the ground. Seeing this, a porter begged him to ride more carefully, upon which Thomas burst out in anger, drew a sword and killed the porter.
The largest category (42 cases) comprises the various crafts and trades that were controlled by guilds, although it seems that some occupations were more frequently named than others. These include, amongst others, goldsmiths (5 cases), bakers (3 cases), tailors (3 cases), fishmongers (3 cases), brewers, carpenters, cobblers, poulterers and skinners (2 cases each); 15 perpetrators are described as servants, but in several cases they may have acted on behalf of their masters.
Men with a religious background were represented well, with a considerable number of perpetrators (11 cases), including, among others, three clercs, two chaplains, the master of a chapel and a priest. In July 1316, for example, a priest climbed over a wall outside Cripplegate to steal some apples, 'as he had been accustomed to do in the past'. On this occasion the gardener was lying in wait. The priest pulled out a knife and stabbed the gardener to death. Just five perpetrators were clearly identified as belonging to the marginal classes of London: beggars, a purse-cutter and a prostitute.
Bibliography
Hawkins, D. (1990). The Black Death and the New London cemeteries of 1348. Antiquity, 64(244), 637-642.
Britnell, R. (1994). The Black Death in English Towns. Urban History, 21(2), 195-210.
Picture credits: painting - Circle of Marten van Cleve; CC